
_edited.png)

A bubble in earnings - not in multiples

The 2026 AI rally is rising on order books and reported profits, while the multiples paid for them are flat or compressing. That is the opposite of 1999.
An evidence-led walk through the four physical proxies of the AI build-out -memory, compute, optical and power - with the actual earnings, contracted backlogs and management commentary behind each. Then the dot-com comparison, an India case study, and a clear answer on the bubble question.
$100B MICRON TAKE-OR-PAY CONTRACTED REVENUE | $73B BROADCOM AI BACKLOG 6 CONFIRMED XPU CUSTOMERS | $163B GE VERNOVA TOTAL BACKLOG POWER IS THE BOTTLENECK | ~26x FWD P/E OF AI SPENDERS VS ~70X FOR 2000 LEADERS |
Every few weeks someone declares AI "just another bubble" and reaches for 1999. It is a clean story, and clean stories are usually the lazy ones. Prices are always high before they are proven right or wrong. The honest question is structural: is this build-out standing on signed orders, sold-out capacity and cash flowing through income statements - or on a valuation resting on a promise that never shows up in
revenue?
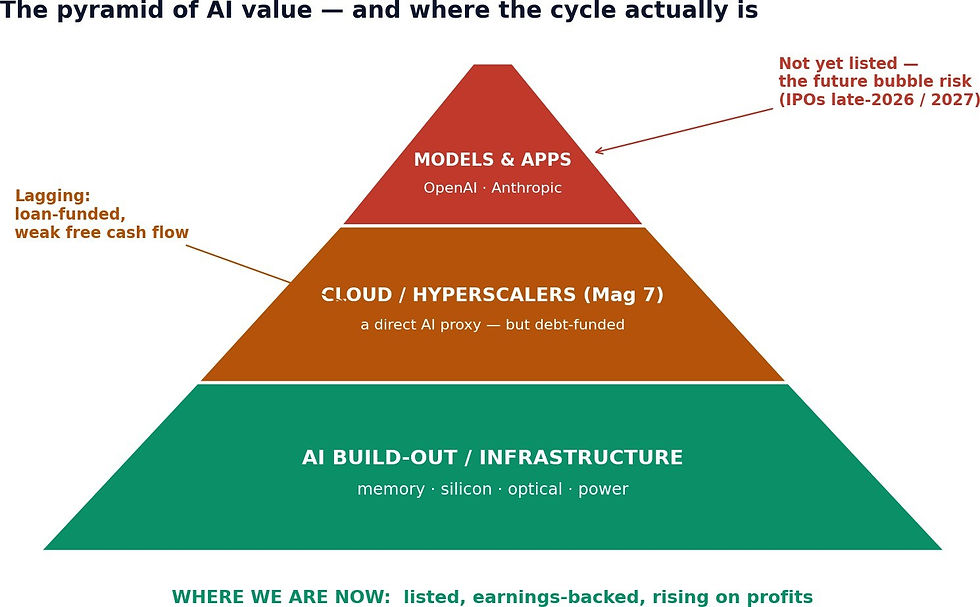
Picture AI as a pyramid. The base is the build-out - memory, silicon, optical, power - listed, earnings-backed, and where the money is actually flowing. One layer up sit the hyperscalers, a direct proxy, but increasingly debt-funded. At the apex sit the models and applications, which have barely begun to list. The froth, when it comes, will form at the top. We are still building the base.
The demand under the earnings is real
Before crediting the profits, test the demand that produces them. Independent work from Exponential View's State of the AI Economy (June 2026) - built bottom-up from filings and deduplicated across the stack - puts deduplicated generative-AI revenue at roughly $110bn on a trailing-twelve-month basis, running at a ~$175bn annualised pace. Crucially, the sector is scaling about three times faster than any prior IT wave - internet, mobile or cloud — when time-aligned to year zero.

Source: Exponential View, The State of the AI Economy (Jun 2026). Deduplicated app, foundation-model & hosting revenue; excludes chip manufacturing.
14× YOY GROWTH IN INFERENCE TOKENS PROCESSED | ~$2.0T COMBINED HYPERSCALER CONTRACT BACKLOG (RPO) | 3.2× ANNUALISED REVENUE GROWTH (35% QOQ, HOLDING) | ~20% OF ALL S&P 500 PROFITS NOW ATTRIBUTABLE TO AI |
The growth is also unusually durable. Quarter-on-quarter revenue growth has held at roughly 35% - about 3.2x annually - across two distinct adoption phases, from the chatbot-subscription era into the agentic-coding era. Token volumes now exceed 30 quadrillion per month, and demand looks genuinely price elastic: Exponential View estimates an elasticity of ~1.2-1.8, so every 10% price cut drives 12–18% more usage and total token spend still rises. That elasticity is the engine of the whole thesis — it is what lets falling token prices grow, rather than shrink, the market.
"The input is electrons, the output is tokens. In the middle is Nvidia." Jensen Huang
CEO · NVIDIA | "Invokes Jevons' Paradox - cheaper inference means more demand, not less; Azure AI demand consistently exceeds available capacity." Satya Nadella
CEO · MICROSOFT · 2026 |
The bubble is in earnings, not in multiples
In a classic bubble, price runs away from earnings and the P/E balloons. That is not what the build-out names are doing. Appreciation is being driven by earnings growth, while forward multiples are flat or compressing. On several of the most important names, next-year EPS growth actually exceeds the forward P/E - a PEG below 1, the antithesis of a bubble's price action.

The table behind the chart - current price, consensus EPS and the implied forward multiple:
COMPANY | PRICE | FY26E | FY27E | GROWTH | P/E NOW | P/E NEXT |
Micron (MU) | $1,132 | $57.71 | $97.77 | +69% | 19.6x | 11.6x |
Nvidia (NVDA) | $192.5 | $8.96 | $13.0e | +45% | 21.5x | 14.8x |
AMD (AMD) | $521 | $7.37 | $14.60 | +98% | 70.8x | 35.7x |
Broadcom (AVGO) | $365 | $6.81 | $9.40 | +38% | 53.6x | 38.8x |
TSMC (TSM) | $432 | $12.50 | $15.00 | +20% | 34.6x | 28.8x |
Vertiv (VRT) | $304 | $6.16 | $8.13 | +32% | 49.3x | 37.4x |
GE Vernova (GEV) | $1,045 | $14.33 | $17.50 | +22% | 72.9x | 59.7x |
Micron is the cleanest illustration: from a $7.68 trough in FY2025 to roughly $98 of forward EPS - a 12.7x increase in earnings power in two years, yet the stock trades under 20x forward and ~12x the year after.


A 12.7x jump in earnings power in two years - underwritten by take-or-pay contracts, not page views.
"AI is not in a bubble; it is in a supercycle. The token-path buyers sit on ~$300B of free cash flow and ~$500B of cash." Gavin Baker
CIO · ATREIDES · JUN 2026 | "AI demand is real and sustainable. - answering the bubble question directly on the Q1'26 call." C.C. Wei
CHAIRMAN & CEO · TSMC |
The Magnificent Seven are now the funding source - not the trade
For three years the entire market was a bet on seven stocks. That trade is over, and most investors haven't adjusted. The Mag 7 have collectively committed to over $680bn of AI capex, and the market has stopped clapping. Through 2026 the group has been among the worst large-cap performers on the board; by early April not one was in positive territory for the year.
The model-builders have been recast from the asset you own into the balance sheet that pays for everyone else's growth. Their margins now carry the depreciation of hundreds of billions of dollars of GPUs; their free cash flow is being shovelled into the very suppliers whose stocks are re-rating.

Capital now rewards whoever holds the contract - not whoever tells the best story.
And the build is increasingly funded with debt - much of it moved off balance sheet. Meta's ~$29.5bn "Hyperion" vehicle was structured at roughly 91.5% leverage (≈10.5:1 debt-to-equity), with Meta leasing the campus back. Oracle is the clearest stress test: ~$156bn of capex commitments, RPO of ~$523bn (~9x revenue), free cash flow already negative, and debt heading past $100bn. Morgan Stanley expects $250–300bn of hyperscaler debt issuance in 2026 alone.
2021–2024: own the narrative - the seven names that are AI. 2025–2026: own the supply chain - the businesses with sold-out capacity and signed, multi-year contracts.
Here is where the earnings are actually accruing - the four physical proxies of the build-out, each with an order book you can audit.
Proxy 1 · Memory & HBM - the cleanest order book in tech
Memory used to be the most cyclical commodity in technology; it has stopped behaving like one. HBM sits next to every accelerator, uses ~4x the wafer area of standard DRAM per bit and earns 3–5x the
revenue per wafer - so every HBM wafer pulls capacity out of ordinary DRAM, creating a second shortage. Gartner pegs 2026 DRAM price increases at ~47%.
MEMORY / HBM · FLAGSHIP Micron $1,132 MU · NASDAQ +166% vs 200d
FQ3'26 revenue $41.46B (+346% YoY), EPS $25.11; $25B data-center revenue in-quarter. Q4 guide $50B ± $1B at ~86% gross margin.
16 take-or-pay agreements → ~$100B contracted revenue + $22B upfront cash · HBM booked through 2027. | COMPUTE · FOUNDRY TSMC $432 TSM · NYSE +27% vs 200d
Q1'26 revenue $35.9B (+40.6% YoY), net profit +58%; HPC now 61% of revenue. FY guidance raised above 30% USD growth. CoWoS scaling 65–75k → 120–130k wafers/month - and still can't clear the queue. |
COMPUTE · GPUS Nvidia $192.5 NVDA · NASDAQ +1% vs 200d
FY26 revenue $215.9B (+65%); Data Center $193.7B. Q1 FY27 DC revenue $75.2B (+92% YoY). Revenue up ~7x in three years - vs Cisco's 4x before 2000.
~800–850k CoWoS wafers booked for 2026 - about 60% of TSMC's entire output. | COMPUTE · CUSTOM SILICON Broadcom $365 AVGO · NASDAQ +1% vs 200d
Q2 FY26 AI revenue $10.8B (+143% YoY); Q3 guided to $16.0B (+200%). Capacity reserved through 2028. $73B AI backlog across 6 confirmed XPU customers · line of sight to >$100B AI chip revenue in 2027. |
"The memory industry has been structurally transformed by the proliferation of AI… supply shortages will take considerable time to improve." Sanjay Mehrotra
CEO · MICRON · FQ3'26 | "Today we have line of sight to achieve AI revenue from chips in excess of $100 billion in 2027." Hock Tan
CEO · BROADCOM · Q2 FY26 |
Proxy 2 · Optical & networking - 36x more fibre per rack
AI clusters must move staggering data between tens of thousands of GPUs, making the network a first class bottleneck - an AI rack needsroughly 36x more fibre than a traditional CPU rack. That
is how a sleepy industrial-glass business became one of the year's best performers.
OPTICAL · FIBRE Corning $223 GLW · NYSE +81% vs 200d
Q1'26 Optical Communications $1.8B (+36%), core EPS $0.70 (+30%). Anchored by a multi-year Meta agreement worth up to $6B. | OPTICAL · TRANSCEIVERS Coherent $381 COHR · NYSE +64% vs 200d
Q3 FY26 Data Center & Comms $1.36B (+41%); EPS $0.97.
Led by 800G and 1.6T transceivers ramping into 2027 · Nvidia-backed. |
OPTICAL · LONG-HAUL / DCI Ciena $480 CIEN · NYSE +50% vs 200d
Q2'26 revenue $1.57B (+40% YoY); direct cloud revenue +70%, hyperscalers ~1/3 of total. FY26 guidance raised to ~$6.3B (+~32%) · first RLS Hyper Rail order placed. | NETWORKING · AI FABRICS Arista Networks $158 ANET · NYSE +10% vs 200d
Q1'26 revenue $2.71B (+35.1%), ahead of guidance; FY26 guide raised to ~$11.5B. AI-fabric revenue target lifted from $3.25B to $3.5B. |
Proxy 3 · Power & cooling - the constraint nobody priced in
An AI data center is, at bottom, a machine for turning electricity into tokens. US electricity net generation - flat from 2008 to 2024 - is now growing ~9 TWh/month, with data centers accounting for ~55% of projected US load growth to 2030 (a forecast that has risen ~7x since 2022). The century-old industrials that solve power and heat now carry semiconductor-style backlogs.
POWER · COOLING Vertiv $304 VRT · NYSE +33% vs 200d
Q4 organic orders +252% YoY; book-to-bill 2.9x; FY26 adj. EPS $5.97–6.07 (+42–45%). Backlog $15B (+109%). | POWER · ELECTRICAL Eaton $403 ETN · NYSE +9% vs 200d
Data-center orders +240% YoY; FY26 organic growth guidance raised to 10%. Total Electrical backlog +48% to $22.8B · Boyd Thermal adds liquid cooling. |
POWER · GRID & GENERATION GE Vernova $1,045 GEV · NYSE +33% vs 200d
Q1'26 orders $18.3B (+71% YoY); DC electrification orders $2.4B in one quarter - more than all of 2025 combined. Total backlog swollen to $163B · +$13B QoQ. | |
"Demand is outstripping supply across wafers, silicon, CPUs, optics and memory - a one or two year industry problem." - Jayshree Ullal, Chair & CEO, Arista · Q1'26

Sterlite - the build-out, re-rated in India
The build-out is not a US-only trade. The same physics - sold-out fibre, trusted-vendor procurement, hyperscaler order books - plays out in India, where the listed proxies are smaller and far less crowded.
With most installed fibre capacity in China and the US, Europe and India all imposing trusted-vendor
norms on critical infrastructure, usable ex-China capacity is far tighter than the headline "glut" suggests
- handing pricing power to the few credible non-China suppliers.

Our entry zone was the distressed turnaround around ₹135, against a consensus that still treated fibre as a structurally oversupplied commodity. The catalyst: an STL subsidiary won a multi-year Product Award Letter worth ~$1.11B (≈₹10,000 crore) to supply optical connectivity for AI-ready US data centres (FY27–FY29), lifting the group order book +334% to ₹19,000 crore. The turnaround is in the numbers - FY26 revenue ₹4,745 crore (+18.7% YoY), a swing to net profit of ₹56 crore (from a ₹123 crore loss), EBITDA margin expanding to 13.2% - with a domestic tailwind underneath: Indian data-centre capacity is set to grow ~5x, from 1.4 GW (2025) to 8 GW (2030).
1999 vs 2026, with numbers
The dot-com era is the ideal benchmark, highlighting key structural differences. In 2000, market leaders held unsustainable valuations, often with zero earnings.
DIMENSION | 2000 - DOT-COM | 2026 - AI BUILD-OUT |
What price rested on | Eyeballs, page-views, market-cap-to-users | Order books, take-or-pay contracts, backlog |
Revenue translation | Often none — ~74% of internet cos had negative cash flow | Direct — bookings convert to revenue & margin now |
Leaders' valuation | Top-4 tech ~70x fwd; Cisco P/E ~472 | AI spenders ~26x; TSMC 24x, Micron 28x, Nvidia 32x |
Funding | Equity/debt against a story; fibre was debt-funded | Hyperscaler cash flow + prepayments (apex still private) |
Supply / demand | Unlimited internet cos; ~99% of fibre went dark | Constrained: CoWoS, HBM, fibre, power; GPUs ~100% used |
Emblematic names | Pets.com, Webvan, Global Crossing - bankrupt | Micron, Nvidia, GE Vernova - record cash earnings |

Source: Xylem analysis. Cisco carried a P/E near 472 and price-to sales near 200x in March 2000, then fell 88% — never to recover it.
The datapoint that captures it: in March 2000 Cisco carried a P/E near 472 and a price-to-sales near 200x, then fell 88% from its peak, never to recover it. Amazon in 1999 had $1.64bn of revenue, a net loss, a $107bn valuation and ten months of cash. Today, AI accounts for roughly 20% of all S&P 500 profits - its earnings weight broadly matches its index weight, which was emphatically not true in 2000.
THE BUY-SIDE STEEL-MAN · GAVIN BAKER, ATREIDES
The structural "not-a-bubble" case maps one-to-one onto the four proxies - the two physical constraints on AI are watts (power) and wafers (memory + silicon):
The build-out is overwhelmingly financed out of hyperscaler operating cash flow, with GPUs running near 100% utilisation - the opposite of the dot-com fibre overbuild, which was debt-funded and left
~99% of capacity dark.
The largest GPU buyers generate ~$300bn of free cash flow a year between them - capex funded from cash, not leverage.
Since ramping AI capex, those same spenders have seen roughly a 10-point increase in ROIC - the spend is earning a return, not destroying one.

THE SOBER COUNTERWEIGHT · EXPONENTIAL VIEW
Balance demands the other side. Even with demand real, "big is still small": AI revenue is equivalent to only ~0.42% of US GDP, and cumulative hyperscaler/neocloud capex reaches~$2 trillion through 2026, with a 2026E depreciation charge approaching $111bn. Quarterly AI revenue only first exceeded quarterly capex depreciation in Q4 2025, and coverage remains thin - depreciation still absorbs roughly 81% of hyperscaler/neocloud GenAI revenue before other costs. The payback is real, but early, and it depends on revenue, utilisation and pricing continuing to compound. That nuance is what keeps this a disciplined thesis, not a cheerleading one. |
"Calls it a "good," industrial bubble: even if it is a bubble… the good ideas will pay for all of the losers." Jeff Bezos
FOUNDER · AMAZON · MAY 2026 | "Sometimes, we see bubbles. Holds put options on Nvidia and Palantir - the model/app names, not the picks-and-shovels." Michael Burry
SCION ASSET MGMT · NOV 2025 |
A bubble is coming - but it isn't today's trade
So where is the bubble? At the top of the pyramid - the LLM and application layer - which is largely still private. The clearest sign it is coming is that the paperwork is now being filed. Anthropic filed a confidential S-1 on 1 June 2026 at a ~$965bn valuation - though notably it is near its first operating profit (~$559m in Q2 '26) on ~$44bn of annualised run-rate revenue, a quality business. OpenAI followed a week later (8 June), eyeing a late-2026/2027 listing at a ~$1 trillion first-day cap - yet it is projected to lose ~$14bn in 2026 and not turn profitable until 2029–2030.
That is the layer where price will run ahead of earnings: a trillion-dollar listing of a company losing fourteen billion a year is the multiple-on-a-dream that defines a bubble. But it hasn't happened yet.
The 2026 build-out is a real, cash-and-order-book-backed industrial super-cycle. The proof is that the stocks rising are rising on earnings, not on an abnormal expansion of their P/E - many screens with PEG below 1.
The most-watched names (the Mag 7) are lagging precisely because they are debt-funding the build and bleeding free cash flow. This is disciplined, selective leadership, not indiscriminate mania. Watch the order books and the apex listings, not the headlines. The day the contracts stop renewing - or the day a trillion-dollar, loss-making model lab lists and capital rotates up the pyramid - is the day the character of this market changes. Until then, the legs are strong.
"A "collapse" is "definitely a possibility" — but under-investing would be the bigger mistake." Mark Zuckerberg
CEO · META · SEP 2025 | "Concedes "elements of irrationality"; if the boom collapses "no company is going to be immune, including us."" Sundar Pichai
CEO · ALPHABET · NOV 2025 |
WHERE THIS THESIS COULD BE WRONG — THE STEEL-MAN
● Debt cuts both ways. If hyperscaler financing tightens, the capex funding every proxy's backlog could be cut at the source - and off-balance-sheet leverage (Meta, Oracle) amplifies the downside.
●Backlogs can be cancelled or pushed. An order book is only as good as the customer's willingness to take delivery; a real capex slowdown turns "sold out" into "renegotiated."
● Circularity. Chipmakers, neoclouds and model labs are increasingly each other's customers and investors; if the funding loop tightens, contracted demand could prove softer than the paperwork.
● Memory and small-caps are still cyclical. HBM has changed memory's character, but new capacity in late 2027 could swing pricing; high-beta names like Sterlite cut both ways on the way down.
● Technicians are wary. BTIG's Jonathan Krinsky notes the semis' markup resembles 1999 and flags 25–30% correction risk; Michael Burry has issued a semiconductor-bubble warning.
SOURCES & NOTES
Company figures from FY2026 earnings releases, prepared remarks and earnings-call coverage (Micron, Nvidia, TSMC,
AMD, Broadcom, Corning, Coherent, Ciena, Arista, Vertiv, Eaton, GE Vernova). Sterlite (STLTECH) from company disclosures and Indian market reporting; entry/exit zones illustrative. Prices and 200-day positioning from a live market-data feed at time of writing. Hyperscaler financing: Meta "Hyperion" SPV, Oracle RPO/FCF, Morgan Stanley issuance estimates, TrendForce capex estimates. Anthropic/OpenAI S-1 filings and valuations per market reporting. Executive statements paraphrased or briefly quoted from public interviews and earnings calls.
Independent macro demand, capex, token-volume and depreciation-coverage estimates are sourced from Exponential View, The State of the AI Economy (Azeem Azhar, William Gildea, Hannah Petrovic, Nathan Warren & Marija Gavrilov; 25 June 2026), built bottom-up from filings and triangulated against silicon, build-cost and traffic proxies. Figures are paraphrased; conclusions remain those of their authors.
This document is for information only — research and analysis, not investment advice, and not a recommendation or solicitation to buy or sell any security. Past performance is not indicative of future results. Prepared by Xylem Investments (Brightseeds Advisors LLP, SEBI-Registered Portfolio Manager, INP000008996).
If you'd like to discuss your portfolio or explore how Xylem can help you navigate this market, consult with us here.


Comments